
What an Amortisation Schedule Actually Shows
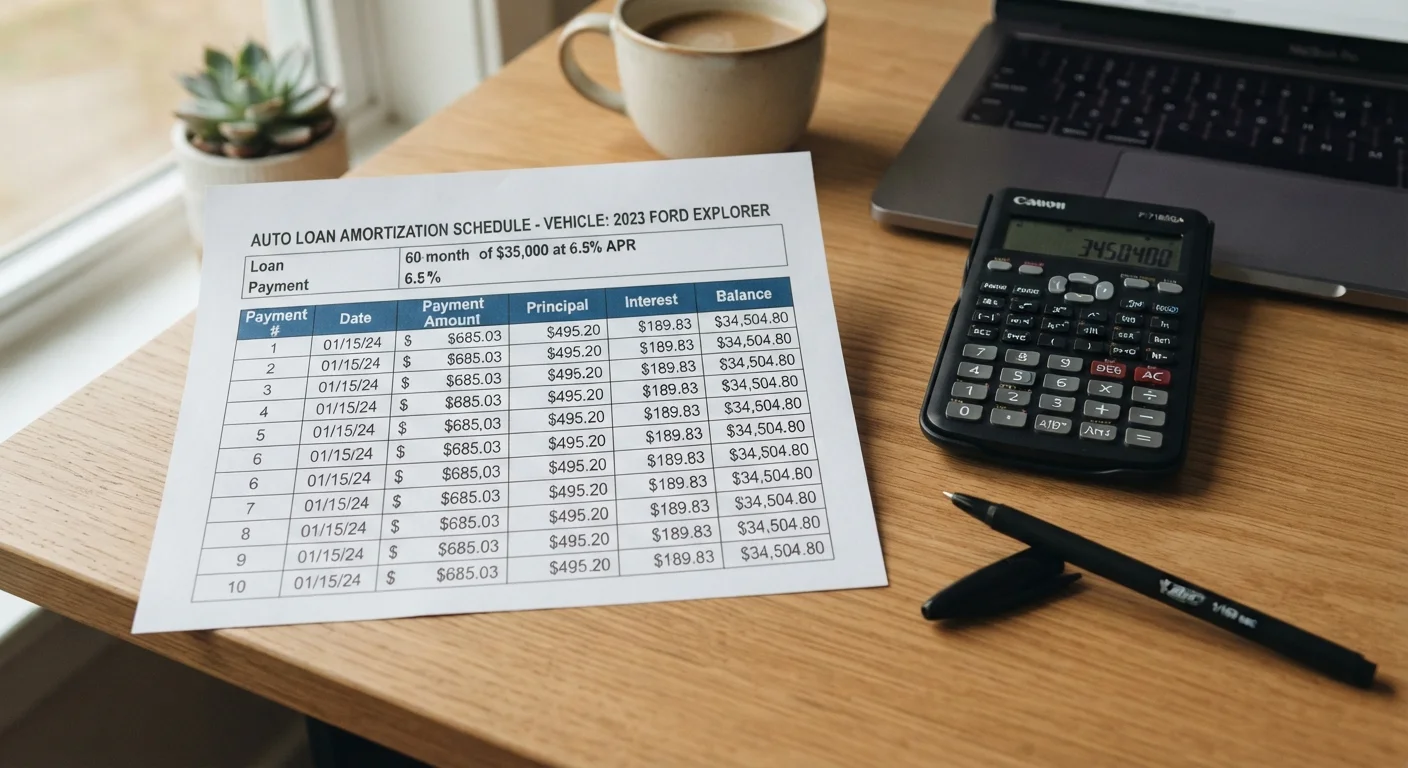
An amortisation schedule is a table — one row per payment — that shows exactly how each monthly payment is divided between interest charges and principal reduction, and what your remaining loan balance will be after each payment clears. It is the most transparent view of loan cost available to a borrower.
Before diving into the table itself, it helps to understand the two components involved. Principal is the amount you borrowed — the part of every payment that actually shrinks your debt. Interest is the lender's fee for extending credit, calculated as a percentage of the outstanding balance. Because interest is recalculated on the remaining balance each period, the split between the two shifts over the life of the loan. For a full breakdown of these building blocks, see Auto Loans Explained: What You're Actually Agreeing To.
The schedule typically includes five columns: payment number, payment amount, interest portion, principal portion, and ending balance. Most lenders will provide this table on request, and free online calculators can generate one from any loan's figures in seconds.
Request the Schedule Before You Sign
You are entitled to review a full amortisation schedule before committing to any loan. Ask for it during the financing discussion — not after. Reviewing it in advance lets you compare total interest across competing offers, not just monthly payments. This one step can meaningfully improve your ability to evaluate a deal objectively.
Why the Early Payments Favor the Lender
The defining feature of an amortised loan is front-loading: a larger share of each payment goes toward interest early in the term, and that ratio gradually reverses as the balance falls. This is not arbitrary — it is the mathematical consequence of applying a fixed rate to a declining balance.
Consider a simplified example. On a $25,000 loan at 7% APR over 60 months, the monthly payment is approximately $495. In month one, roughly $146 of that payment is interest (7% ÷ 12 × $25,000) and only $349 reduces the principal. By month 30, the interest portion has dropped to around $86 because the balance is lower. By month 60, nearly the entire payment retires principal. The cumulative interest paid over the full term is approximately $4,700 — money that never appears on a window sticker but represents a real cost of the financing decision.
This front-loading dynamic has a direct practical implication: the longer the loan term, the more interest accrues in total, even if the monthly payment seems more manageable. Stretching a loan from 48 to 72 months at the same rate will meaningfully increase lifetime interest cost. For clarity on how different interest structures affect this calculation, Simple vs. Precomputed Interest: Which Loan Structure Costs More? offers a useful comparison.
Longer Terms Amplify Total Interest Cost
A 72- or 84-month loan lowers your monthly payment but extends the period during which interest accrues on a still-large balance. Before accepting a longer term, use the amortisation table to calculate the cumulative interest difference compared to a shorter term. The monthly savings may be smaller than you expect relative to the added total cost.
How to Read the Table Step by Step
Follow the steps below using any amortisation schedule — whether provided by a lender or generated online. You will need the loan amount, APR, and term length.
What you will need
Locate or generate the full amortisation table
Request the full payment schedule from your lender before or after signing. If the lender does not supply one, enter the loan's principal, APR, and term into any reputable online amortisation calculator. Verify the monthly payment figure matches what you were quoted — if it differs, recheck the inputs or ask your lender to reconcile the difference.
Identify the five core columns
Confirm the table contains: Payment Number (which month), Payment Amount (fixed monthly total), Interest Paid (lender's fee that period), Principal Paid (balance reduction that period), and Remaining Balance (what you still owe after this payment). Some schedules add a cumulative interest column — this is particularly useful for comparing total loan cost.
Read the first-row split carefully
Row one represents your first monthly payment. Note what fraction goes to interest versus principal. On most standard auto loans, interest will consume a substantially larger share in month one than in later months. This is your baseline — the most expensive month for interest, in proportional terms.
Find the crossover point
Scan down the table and locate the row where the principal portion first exceeds the interest portion. This is the crossover point — from this payment forward, more of each dollar goes to reducing your balance than to the lender's fee. On a typical 60-month loan at moderate APR, this shift often occurs somewhere around the midpoint of the term.
Check the cumulative interest at payoff
Go to the final row of the table. The cumulative interest figure — either shown directly or derived by summing the interest column — is the total financing cost above the principal. Compare this figure across two or more loan offers with different APRs or terms. A lower monthly payment that extends the term may carry a substantially higher total interest cost.
Model the impact of extra principal payments
Most amortisation calculators allow you to input additional monthly or one-time principal payments. Run a version with an extra $50–$100 per month directed to principal and compare the resulting cumulative interest and payoff date against the base schedule. Because interest is front-loaded, extra principal payments made early in the loan have a compounding effect on savings.
Once you can read a single schedule fluently, comparing two or more offers side by side becomes straightforward. Differences in APR and term length show up clearly in the cumulative interest column — making it easier to evaluate the actual cost gap between financing deals rather than comparing monthly payments alone. For a broader framework, Auto Loan Rates and Payments: An End-to-End Guide covers the full picture from rate-setting to payment evaluation.
This article provides general financial education and is not personalised financial advice. Consult a licensed financial professional for guidance specific to your situation.