
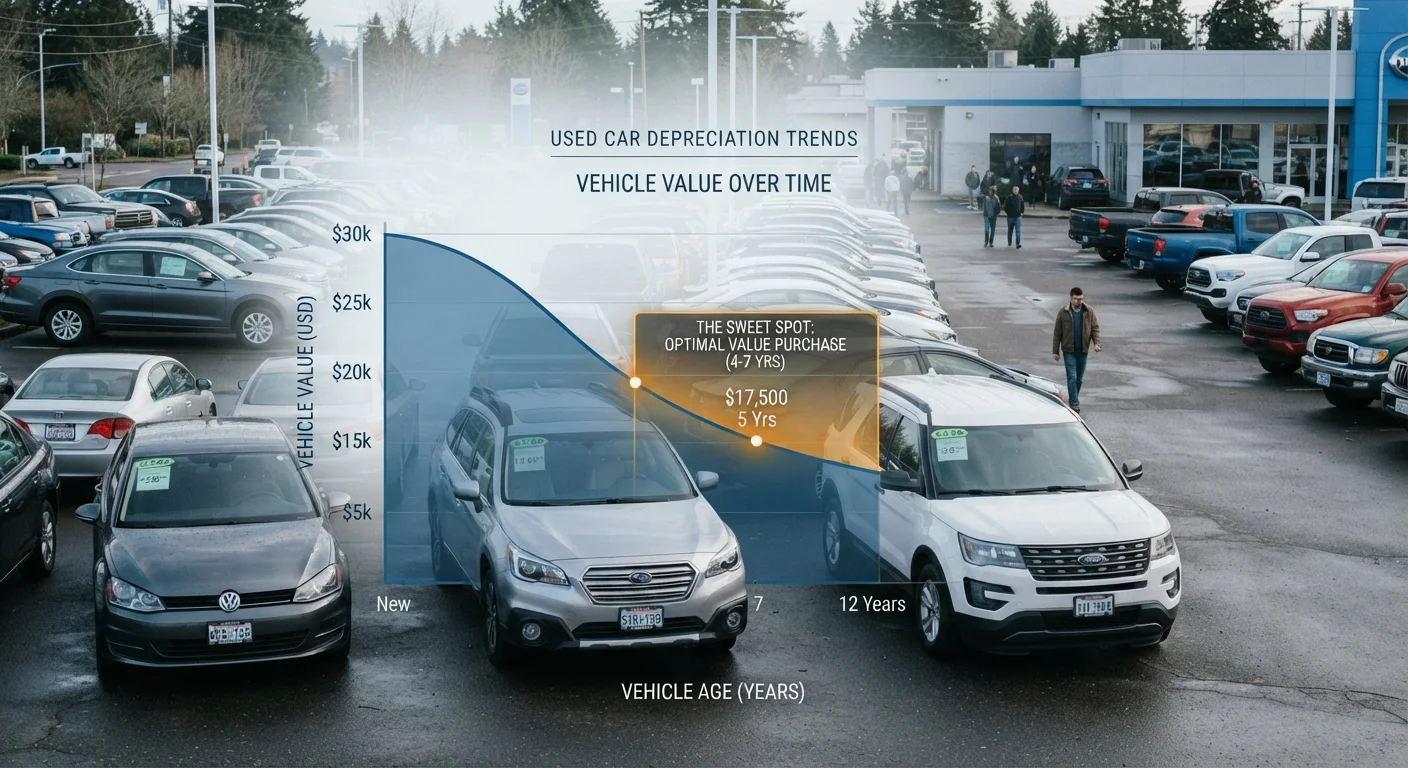
Why the Depreciation Curve Matters More Than the Sticker Price
Most buyers focus on the purchase price. Savvy buyers focus on the rate of value loss — because that determines how much you're actually paying to use the vehicle over time. A car's depreciation curve maps how its market value declines from the day it's first sold. Understanding it lets you time a purchase to capture someone else's loss instead of absorbing it yourself.
As covered in our overview of how depreciation shapes the new vs. used decision, the steepest drop happens in the first one to three years. By year three, many vehicles have shed 35–50% of their original MSRP. After that, the curve flattens — value loss continues but far more gradually. That inflection point is where the math starts working in a used buyer's favor.
~20%
Average first-year depreciation for new vehicles
Industry estimates from automotive valuation researchers consistently place the first-year drop between 15–25% for most mainstream vehicle segments in the US market.
35–50%
Typical value lost by year three
Many mainstream models lose roughly a third to half of their original MSRP within the first three years, according to long-term residual value analysis from automotive data firms.
Where the Curve Steepens and Where It Flattens
Depreciation doesn't move at a constant pace. The sharpest decline almost always happens immediately after a new vehicle is purchased — driven by the gap between retail and wholesale pricing, not actual wear. From there, annual losses in percentage terms tend to shrink. By years five through seven, many mainstream vehicles are losing only 5–10% of remaining value per year.
For a practical breakdown of how this plays out across vehicle types, see our explanation of new car depreciation curves. The key takeaway: not all curves are the same. Luxury vehicles often depreciate faster in absolute dollar terms but retain a different percentage profile. Trucks and certain SUVs have historically held value longer due to sustained demand. Economy sedans frequently have the steepest early drop and a flatter tail.
“The used car market rewards buyers who understand that they're not just buying a vehicle — they're buying a position on a value curve. Getting that position right is often worth more than any negotiation tactic.”
— Car Ownership Costs Editorial Team, Automotive consumer finance researchers
Best Practices for Identifying Your Target Window
Knowing that depreciation curves exist is the starting point. Knowing how to use them to choose a specific purchase window is what actually changes your outcome.
Target vehicles in the three-to-five year age range as a starting point.
This window captures the largest share of the initial depreciation drop while typically keeping the vehicle within the original powertrain warranty period or just past it. Maintenance costs are usually still predictable, and the previous owner absorbed the steepest value loss.
Research the specific model's historical depreciation profile, not just general averages.
Segment-wide rules of thumb can mislead. A pickup truck and a mid-size sedan age very differently in the market. Model-specific residual value data — available through automotive research tools and auction price references — gives you a far more accurate picture of where the curve bends for that vehicle.
Account for major refresh or redesign cycles when timing your purchase.
When an automaker releases a redesigned version of a model, the outgoing generation often drops in resale value faster than the curve alone would predict. Buying the prior generation shortly after a new one launches can offer extra discount — but factor in that parts and service support for older generations may eventually become limited.
Check total cost of ownership, not just purchase price, when comparing curve positions.
A vehicle at the steeper part of its depreciation curve may appear cheap but carry higher insurance costs, lower fuel efficiency, or approaching major service intervals. A slightly higher purchase price at a different curve position may result in lower five-year total spend.
Use certified pre-owned programs as one reference point, not a price ceiling.
CPO pricing often reflects a premium above raw market value in exchange for inspection standards and warranty extension. Understanding the underlying depreciation curve helps you evaluate whether that premium is justified for the specific vehicle and your risk tolerance.
This article is for general informational purposes only and does not constitute personalised financial or purchasing advice. Vehicle values, depreciation rates, and market conditions vary widely by region, make, model, trim, and individual vehicle history. Consult current market data and, where appropriate, a qualified adviser before making any purchase decision.
Quick Actions You Can Take Before You Start Shopping
Before you visit a lot or browse listings, do the groundwork. A few targeted research steps can sharpen your target window and keep you from overpaying on a vehicle that's still near the top of its depreciation curve.
For a broader look at how used and new pricing compare across the full ownership period, the new vs. used depreciation comparison is a useful reference. And if you're also thinking about when during the calendar year to buy, the Deal Timing and Offers hub covers seasonal and market-cycle patterns that interact with depreciation positioning.