
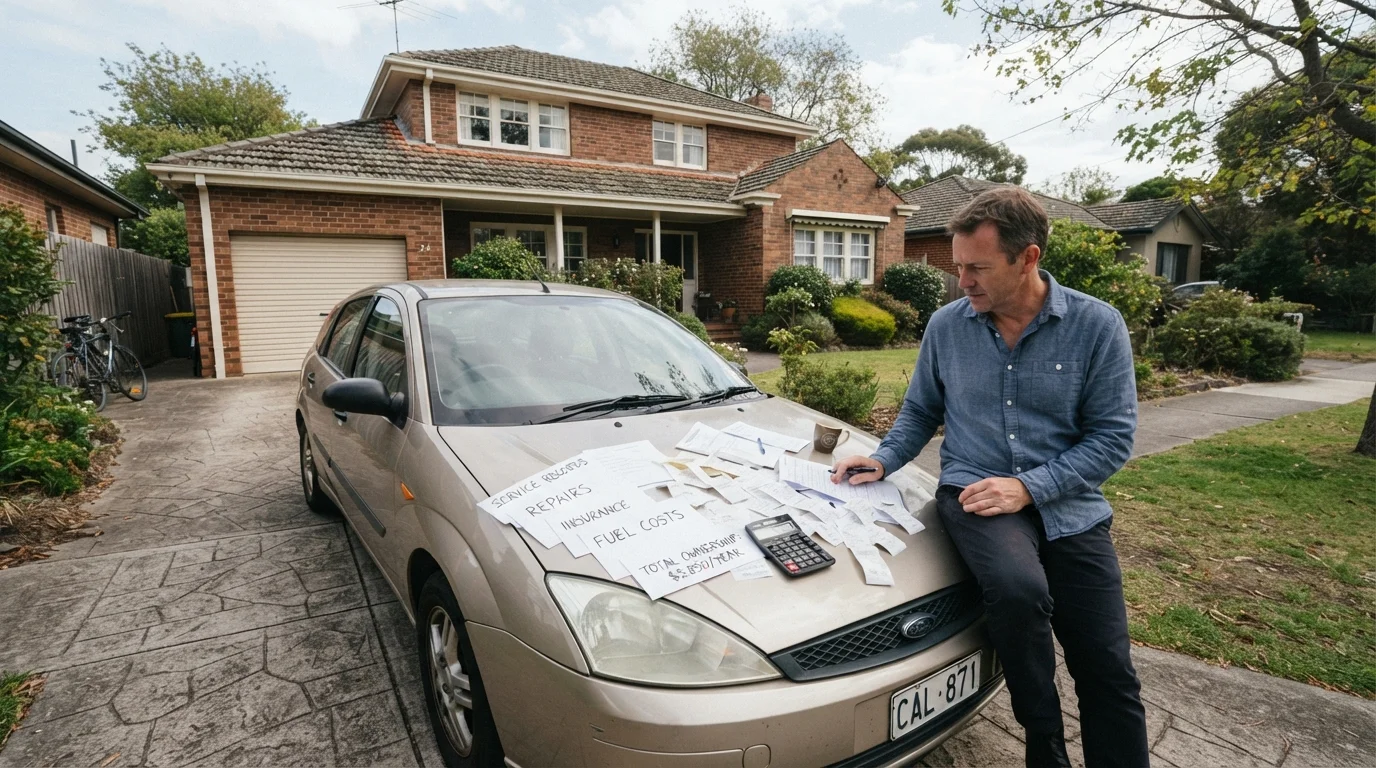
Why the Purchase Price Is a Misleading Starting Point
When most people shop for a car, they anchor to one number: the price on the window sticker. But that figure captures only a fraction of what you'll actually spend. According to AAA's annual Your Driving Costs study, the average American driver spends well over $10,000 per year to own and operate a typical new vehicle — a figure that accounts for depreciation, fuel, insurance, maintenance, and fees. The sticker price alone says nothing about any of that.
Understanding the full ownership picture is not just useful for budgeting — it changes which vehicles look affordable and which ones don't. A lower-priced vehicle with high insurance rates and poor fuel economy can end up costing more over five years than a pricier model with stronger resale value and lower running costs. See our guide to building a complete car budget for a framework to apply this thinking before you buy.
$10,000+
Average annual cost to own and operate a new vehicle
According to AAA's annual Your Driving Costs study, encompassing depreciation, insurance, fuel, and maintenance.
$2,000+
Average annual full-coverage auto insurance premium
Based on national averages reported by multiple insurance industry sources; actual premiums vary by driver profile and state.
~19%
Interest cost added on a typical 60-month auto loan at 7% APR
Calculated on a $35,000 loan balance, illustrating how financing terms significantly affect total vehicle cost.
Taxes, Title, and Registration: The Upfront Extras
Before a car leaves the lot, several government-mandated costs are added to the transaction. Sales tax varies widely by state — typically ranging from 0% in states like Oregon and Montana to over 9% in parts of Tennessee. On a $35,000 vehicle, that difference can mean $3,000 or more just in tax. Title transfer and documentation fees add further charges, and while some are regulated, dealer doc fees in particular can range from nominal to several hundred dollars depending on the state.
Registration fees are assessed annually and are calculated differently by each state. Some states base fees on a flat rate; others tie them to the vehicle's value, weight, or model year. A newer or heavier vehicle will often carry a higher initial registration cost that decreases as the car ages. These recurring charges are often overlooked in ownership budgets — our annual ownership fee checklist can help you track every one of them year over year.
Dealer Documentation Fees Vary — and Are Often Negotiable
Doc fees charged by dealers can range from under $100 to over $800 depending on state regulations and the dealership. In some states, these fees are capped by law; in others, dealers set them freely. Ask for the fee schedule in writing before you begin negotiations so you're comparing total out-the-door prices, not just vehicle prices.
Insurance: A Cost That Follows You Every Year
Auto insurance is not optional — all U.S. states require at minimum liability coverage, and lenders require comprehensive and collision coverage on financed vehicles. Premiums vary based on your driving record, location, credit history (in most states), age, and the specific vehicle you drive. The make and model matter more than many buyers expect: a sports sedan, a high-theft-rate vehicle, or a car with expensive repair parts can carry premiums meaningfully higher than a mainstream family sedan.
On average, full-coverage auto insurance in the U.S. costs over $2,000 per year, though this varies considerably by state and driver profile. It's general information only — your actual premium will depend on your specific circumstances, and you should consult a licensed insurance agent for guidance tailored to your situation. What's important to factor into any ownership estimate is that this cost recurs annually and can increase even if your own behavior doesn't change, due to broader market forces like rising repair costs.
Before finalizing a vehicle choice, request an insurance quote on that specific year, make, and model — not just the category. Premium differences between two similarly priced vehicles can exceed $600 per year.
Insurance pricing is driven by the actual vehicle, not just its price tier. Buyers who skip this step often discover the cost gap only after purchase.
When estimating depreciation, look up the vehicle's current private-party resale value at three and five years of age — not just new MSRP — to get a real sense of value retention.
Depreciation projections based on category averages can be misleading; actual resale data for the specific model gives a more actionable figure.
Depreciation: The Invisible Drain on Your Investment
Depreciation is the difference between what you paid for a vehicle and what it's worth when you sell or trade it in. For most new vehicles, this loss is front-loaded: industry data generally suggests new cars can lose a significant portion of their value in the first few years of ownership, though the exact rate varies by model, market conditions, and mileage. During periods of strong used-car demand, depreciation rates have shifted, but over a typical five-year span, it remains the single largest cost of ownership for most buyers.
Depreciation doesn't show up on a monthly bill, which is why it's so easy to ignore — but it represents real money leaving your household. For a deep dive into how depreciation works and how to factor it into a vehicle comparison, see our complete guide to depreciation and total ownership cost. If you're weighing a new versus used vehicle, depreciation math is one of the most important factors to run.
“Depreciation is the silent killer of vehicle value. Most buyers focus on what they pay at the dealership, but the more important question is what the car will be worth when they're ready to move on.”
— Consumer Automotive Research Desk, Industry analysis unit tracking vehicle ownership cost trends
Fuel, Maintenance, and Recurring Annual Fees
Fuel is the most visible ongoing cost for most drivers because it hits every week. At average U.S. fuel prices and typical driving distances, fuel costs for a gasoline vehicle can run $1,500–$2,500 per year depending on the vehicle's efficiency and how much you drive. EVs shift this cost to electricity, which is generally lower per mile but brings its own variables — charging infrastructure, home charging setup, and utility rates. Our EV charging and costs hub covers what that shift looks like in practice.
Routine maintenance — oil changes, tire rotations, brake service, filters — is predictable but cumulative. Most vehicles require several hundred dollars of routine service annually, rising as mileage and age increase. Some newer vehicles have extended service intervals and included maintenance plans that affect this figure. Our maintenance and repairs hub provides real cost benchmarks across common service categories. Beyond maintenance, many states require annual safety or emissions inspections that carry their own fees.
Financing Costs: What Interest Actually Adds Up To
Most vehicles are purchased with financing, and the total interest paid over a loan term is a real ownership cost that belongs in any budget calculation. On a $35,000 loan at a 7% APR over 60 months, the total interest paid amounts to roughly $6,600 — adding nearly 19% to the nominal purchase price. Longer loan terms reduce the monthly payment but increase total interest significantly. Loan terms of 72 or 84 months, now common, can mean paying interest for years on a vehicle that has already depreciated substantially.
Beyond the interest rate itself, add-on products sold at the financing desk — extended warranties, gap insurance, credit insurance — can roll into the loan balance and compound interest costs further. Understanding what's optional and what's required is critical. See what happens at the back end of an auto loan for a walkthrough of common finance-desk add-ons.
Longer Loan Terms Increase Total Cost Significantly
Stretching a loan to 72 or 84 months cuts your monthly payment but dramatically increases total interest paid — and may leave you owing more than the car is worth for a period of years. This situation, known as being 'underwater' or 'upside down' on the loan, limits your options if you need to sell or the vehicle is totaled. Factor the full loan cost — not just the monthly amount — into your ownership budget from the start.
Building a Complete Ownership Budget
A realistic ownership budget requires estimating all six major cost categories: depreciation, financing costs, insurance, fuel, maintenance, and fees/taxes. Adding these up for a specific vehicle — even with rough estimates — almost always produces a number that surprises buyers who focused only on the monthly loan payment. The full picture of ongoing car ownership costs article works through how these categories interact for a typical vehicle purchase.
If you're comparing vehicle types — say, a traditional gas vehicle against a hybrid or EV — note that the category weights shift meaningfully. EVs tend to have lower fuel and maintenance costs but different depreciation curves and higher insurance premiums in many markets. Our powertrain running costs guide breaks down how these trade-offs play out. And if you're evaluating new versus used, ownership cost factors worth calculating before you buy is a useful companion piece.
This article provides general financial and consumer information for educational purposes only. It is not personalized financial, insurance, or legal advice. Costs, rates, and fees vary significantly by state, lender, insurer, and individual circumstances. Consult qualified professionals — including a licensed insurance agent and a financial adviser — before making decisions specific to your situation.
Use a Total Cost of Ownership Estimate, Not Just Monthly Payments
When comparing two vehicles, calculate a five-year total cost estimate that includes depreciation, insurance, fuel, maintenance, fees, and financing — not just the loan payment. This one shift in perspective often reorders which option looks most financially sound. Many automotive research sites offer free TCO tools to assist with this calculation.