
Why Valuation Reports Confuse Buyers
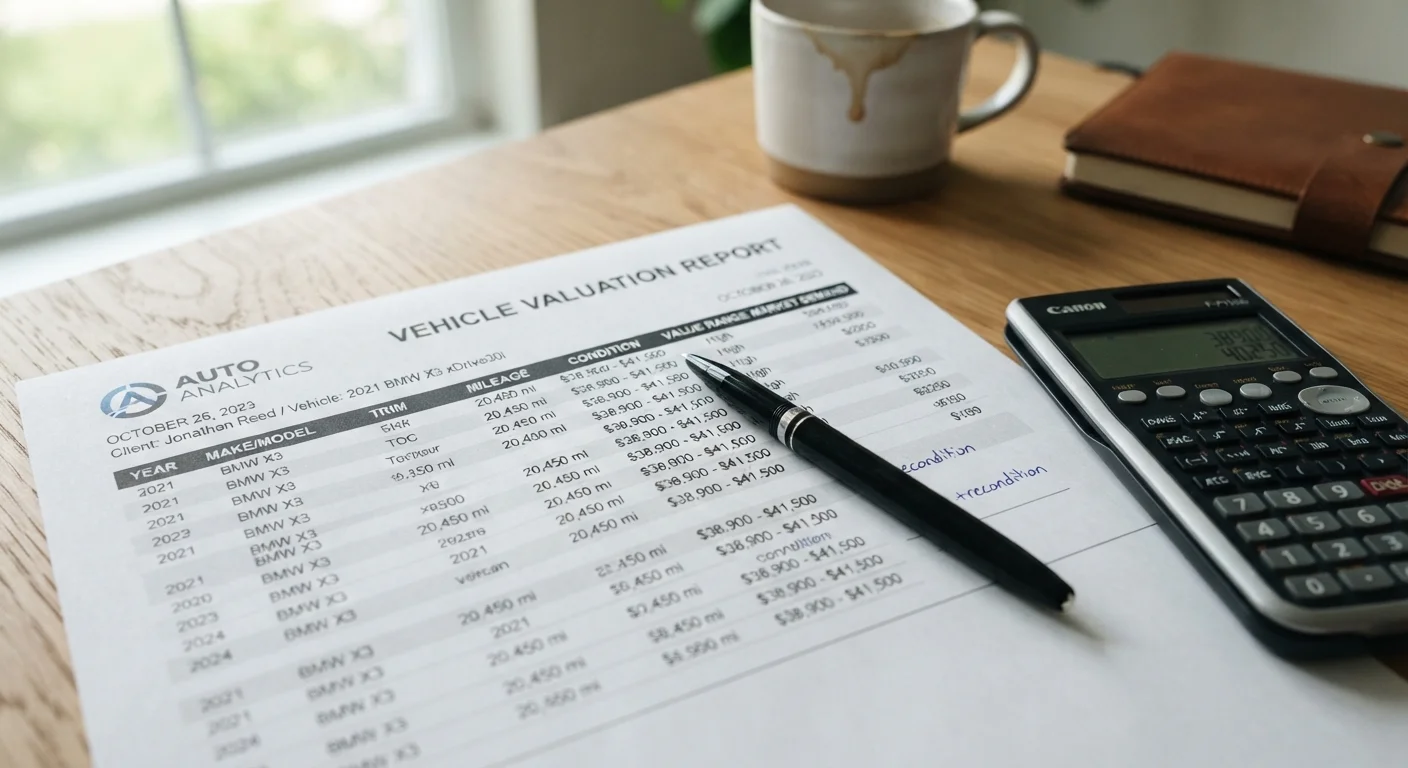
A vehicle valuation report looks authoritative — columns of figures, condition matrices, historical charts. But the numbers are only useful if you know what question each one is answering. Most buyer confusion comes from three sources: not knowing which value tier applies to their situation, ignoring condition and mileage adjustments that shift the number significantly, and treating a modeled estimate as a fixed market price.
This guide walks through a valuation report section by section, so you know which figures deserve attention and which are background context. A valuation report is a different document from a vehicle history report — if you want to understand what the latter covers and where it falls short, what a vehicle history report can and cannot tell you covers that ground separately.
What you will need
Vehicle Valuation Report
The primary document you're interpreting — provides estimated values across multiple tiers and conditions.
Used-Car Listing Platform
Used to cross-reference reported values against real asking prices in your local or regional market.
Vehicle History Report
Provides accident, title, and ownership data that may affect condition adjustments cited in the valuation report.
Step-by-Step: Reading the Report
Follow these steps in order. Each builds on the last, and skipping ahead — particularly past condition and mileage adjustments — is the fastest route to misreading the final figure.
Check the Report Date Before Anything Else
Vehicle market values can shift meaningfully over a few months, especially in volatile used-car markets. Always confirm the report was generated within the last 30 days before relying on its figures. An outdated report may significantly overstate or understate what a vehicle is actually worth today.
Seller-Provided Reports May Use Favorable Value Tiers
When a seller presents you with a valuation report, check which value tier is cited. Sellers often reference the 'retail' or 'clean' figure — the highest tier — which may not reflect the vehicle's actual condition or the price you'd realistically pay elsewhere. Always locate the trade-in or private-party equivalent to understand the full value range.
Identify the Value Tiers Listed in the Report
Most valuation reports present three to four distinct value tiers: trade-in (what a dealer might offer), private party (peer-to-peer sale estimate), and retail (what a dealer lists it for). Some reports also include a certified pre-owned tier. Each number in the same column on the same report can differ by $1,500–$4,000 or more depending on the vehicle.
Identify which tier is relevant to your transaction. If you're selling to a dealer, focus on trade-in. If you're buying from a private seller, private-party is your anchor. Retail figures are most useful when comparing dealer asking prices.
Locate the Condition Grade and Its Adjustments
Reports assign a condition grade — typically Excellent, Good, Fair, or Poor — and apply dollar adjustments to the base value accordingly. An "Excellent" rating often assumes no mechanical issues, clean interior, no paint defects, and up-to-date service records. In practice, very few used vehicles qualify for "Excellent."
Find the adjustment table or footnotes that show how much each condition step adds or subtracts. Then honestly assess the vehicle against those criteria. Overestimating condition is one of the most common ways buyers overpay.
Read the Mileage Adjustment Line
Valuation reports base their figures on a typical annual mileage benchmark — commonly around 12,000–15,000 miles per year in the US. If the vehicle you're evaluating deviates from this norm, the report should show a mileage adjustment (positive or negative) applied to the base figure.
Locate this line explicitly. High-mileage vehicles carry negative adjustments; low-mileage vehicles may carry a positive premium. Confirm the adjustment is proportionate — a vehicle with 40,000 miles more than average shouldn't show only a token deduction.
Examine the Depreciation Curve Data
Better valuation reports include a depreciation history — a chart or table showing how the vehicle's value has changed year over year. This is one of the most informative sections for long-term ownership decisions.
Look for the rate of value loss between years 1–3 versus years 4–7. Vehicles that depreciate steeply in the first three years but then level off represent lower financial risk if you're planning to own for five or more years. If the depreciation curve stays steep into years 5 and 6, the vehicle is a weaker long-term hold. This data directly informs resale timing and total cost of ownership. For more on how these figures interact with financing, see key numbers that shape every auto finance decision.
Cross-Reference the Report Against Active Market Listings
A valuation report reflects modeled market data — it's backward-looking by nature. To understand what the vehicle actually transacts for today, spend 10–15 minutes searching comparable listings on a public used-car platform. Filter by the same year, make, model, trim, approximate mileage, and your region.
Note the spread between listed prices and the report's retail value. If active listings are consistently priced below the report's retail figure, the modeled data may be lagging a softening market. If listings are above it, demand may be stronger than the model reflects. This gap is your real-world calibration. For additional context on listing details worth scrutinizing, see reading a used-car listing effectively.
Synthesize the Numbers Into a Working Value Range
You now have: condition-adjusted tier values, a mileage-adjusted base, depreciation trend data, and live market comparables. Combine these into a working range — a floor and ceiling that reflect realistic transaction prices for this specific vehicle in its current condition.
Your floor is the condition-adjusted trade-in or private-party value. Your ceiling is the lower end of active retail listings for comparable vehicles. Any asking price above your ceiling deserves a clear justification — certified warranty, recent service, documented low accident history. If you're unclear about how pricing elements get layered into a final transaction number, common misreadings of car price quotes is a useful companion read.
Valuation Reports Are Estimates, Not Guarantees
No valuation report — regardless of the source — can guarantee what a specific vehicle will sell for. These figures are statistical estimates derived from aggregated market data and may not reflect local supply-and-demand conditions, recent auction results, or unique vehicle attributes. Use them as a reference range, not a fixed price. For decisions involving significant sums, consult a qualified automotive appraiser or a licensed dealer.
Putting the Numbers in Context
A valuation report is one input, not a verdict. Market conditions, regional supply, and vehicle-specific history all influence what a transaction actually closes at. The steps above give you a working range grounded in the report's own data and real-world comparables — which puts you in a far stronger position than someone anchoring on a single headline figure.
If you're also evaluating how a vehicle's depreciated value affects your financing terms — particularly loan-to-value ratio or residual value in a lease — the financing numbers that matter most explains how those figures interact. For a look at how deal-sheet line items connect to valuation, see reading a car deal sheet without getting lost.
This article provides general educational information about vehicle valuation methods and is not a substitute for personalized advice from a qualified automotive appraiser, dealer, or financial professional. Valuation figures vary by source, region, and market conditions. Always review actual documentation and consult a licensed professional before making significant purchase or finance decisions.