
How Depreciation Actually Works
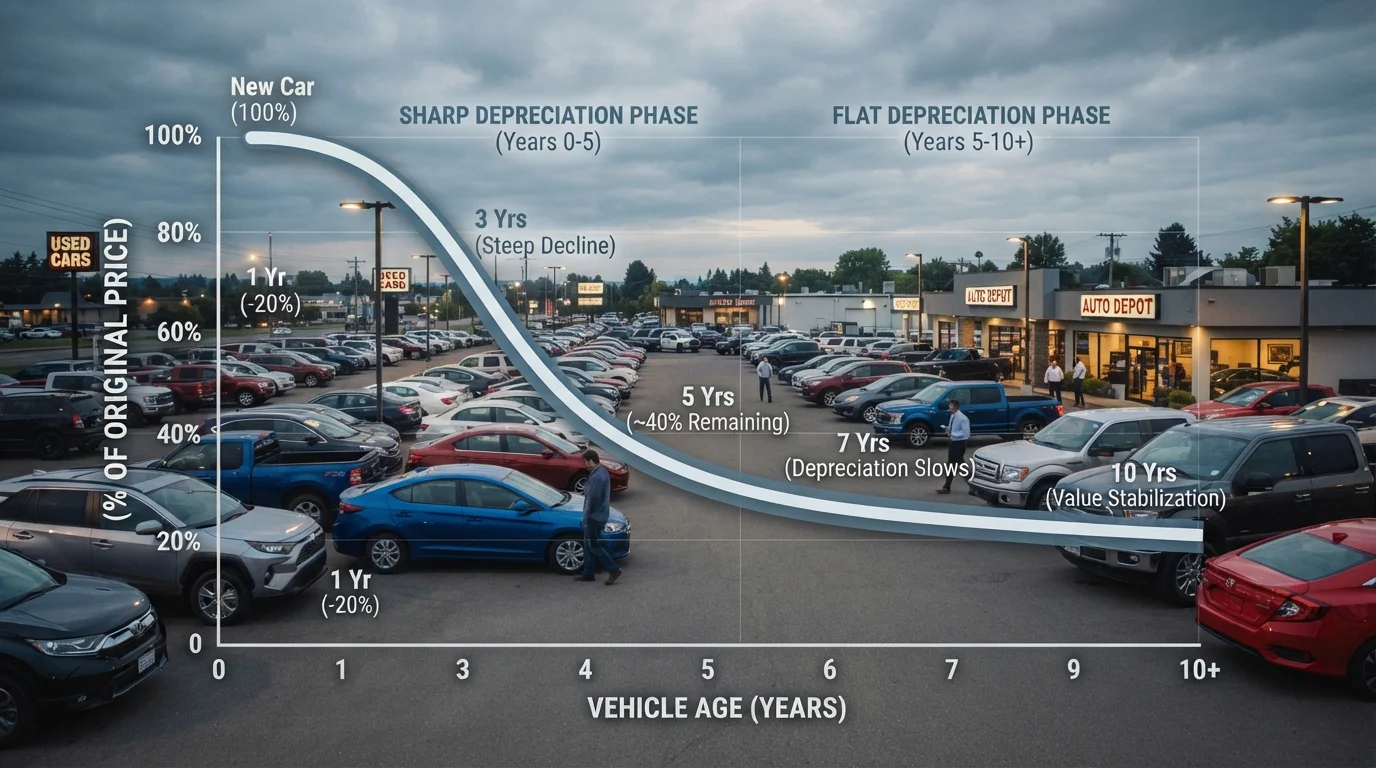
Most buyers understand that cars lose value over time, but few appreciate how uneven that process is. A vehicle doesn't shed value at a steady annual rate — it front-loads its losses heavily in the first one to three years, then settles into a much slower decline.
That front-loading is a direct consequence of the new car premium. The moment a buyer takes ownership, the vehicle transitions from "new" to "used" in the market's eyes, removing the intangible value tied to being first owner, factory-fresh, and fully under warranty. That alone accounts for a meaningful share of the year-one drop.
For a deeper look at how this dynamic shapes the overall new-vs-used decision, see how depreciation shapes the new vs. used choice. And for a side-by-side financial view, new car vs. used car depreciation compared breaks down total ownership cost implications.
~20%
Typical first-year depreciation rate
Industry valuation data consistently shows new vehicles lose roughly 15–25% of their value in the first year of ownership, with variation by vehicle type and brand.
~50%
Value lost by year five on average
By the five-year mark, many vehicles have depreciated to around half their original MSRP, though trucks and certain SUVs have historically outperformed this average.
The Depreciation Curve: Where the Value Windows Open
Think of a vehicle's depreciation over time as a steep ski slope that gradually levels into a gentle incline. The steepest section — year one through roughly year three — is where new car buyers absorb the heaviest losses. For used buyers, this is the section to avoid paying for.
The curve typically begins flattening between years three and five. At that point, a vehicle has already shed a large portion of its original value, but it often retains many years of reliable service life. This is the zone where used buyers frequently find the most favorable ratio of remaining utility to purchase price.
Beyond year five, depreciation continues but at an even slower rate in percentage terms — though absolute dollar values become smaller, and the risk profile of the vehicle (wear, repair likelihood) begins to rise. The optimal window is genuinely different for every buyer depending on risk tolerance, intended use, and financing situation.
What Distorts the Curve
The textbook depreciation curve assumes normal market conditions, but real-world pricing regularly deviates from it. Several factors push individual vehicles off the standard trajectory:
- Supply and demand shifts: When new vehicle inventory tightens, used prices rise to compensate, sometimes pushing values above what age-based models would predict. Market conditions affect new and used prices differently, and understanding those patterns helps you choose the right moment to buy.
- Trim and specification: Base trims and oddly-specced vehicles depreciate faster because the buyer pool is smaller. Popular mid-range trims tend to hold value better. See factors that quietly erode a used car's value for the full picture.
- Fuel type transitions: Shifts in consumer preference — toward or away from certain powertrains — can accelerate or stall depreciation for entire vehicle categories.
- Service history and accident records: A clean history supports value retention; gaps or disclosed incidents pull pricing down, sometimes below what the age-based curve would suggest.
Check Total Depreciation, Not Just Age
A five-year-old vehicle isn't automatically a better value than a three-year-old one. Run the math on how much of its original MSRP the vehicle has already shed. A popular model that holds value well may still be sitting high on its curve at five years, while a less sought-after model may have already hit its floor at three.
Putting Timing to Work as a Buyer
Understanding depreciation in theory only helps if you can apply it when you're actually shopping. The practical question is: where does this specific vehicle sit on its curve right now?
Checking pricing across multiple listing platforms against a vehicle's original MSRP gives a rough sense of total depreciation to date. Comparing that to typical depreciation rates for the same make and model (resources like industry valuation guides publish these) tells you whether you're looking at a vehicle that's already absorbed its steepest losses or one still sliding.
For a more structured approach to identifying where a vehicle sits, buying at the right point on the depreciation curve walks through how to locate and act on that inflection point. And for the broader case for used vehicles, the genuine advantages of buying used covers benefits that often get overlooked.
Ultimately, timing a used car purchase isn't about waiting indefinitely for rock-bottom pricing. It's about identifying the zone where a vehicle's value has stabilized — where you're not subsidizing the previous owner's depreciation, but you're also not taking on a vehicle that's approaching the end of its economical service life.
This article provides general educational information about vehicle depreciation. It is not financial or purchasing advice tailored to your individual circumstances. Consult a qualified financial adviser for decisions specific to your situation.