
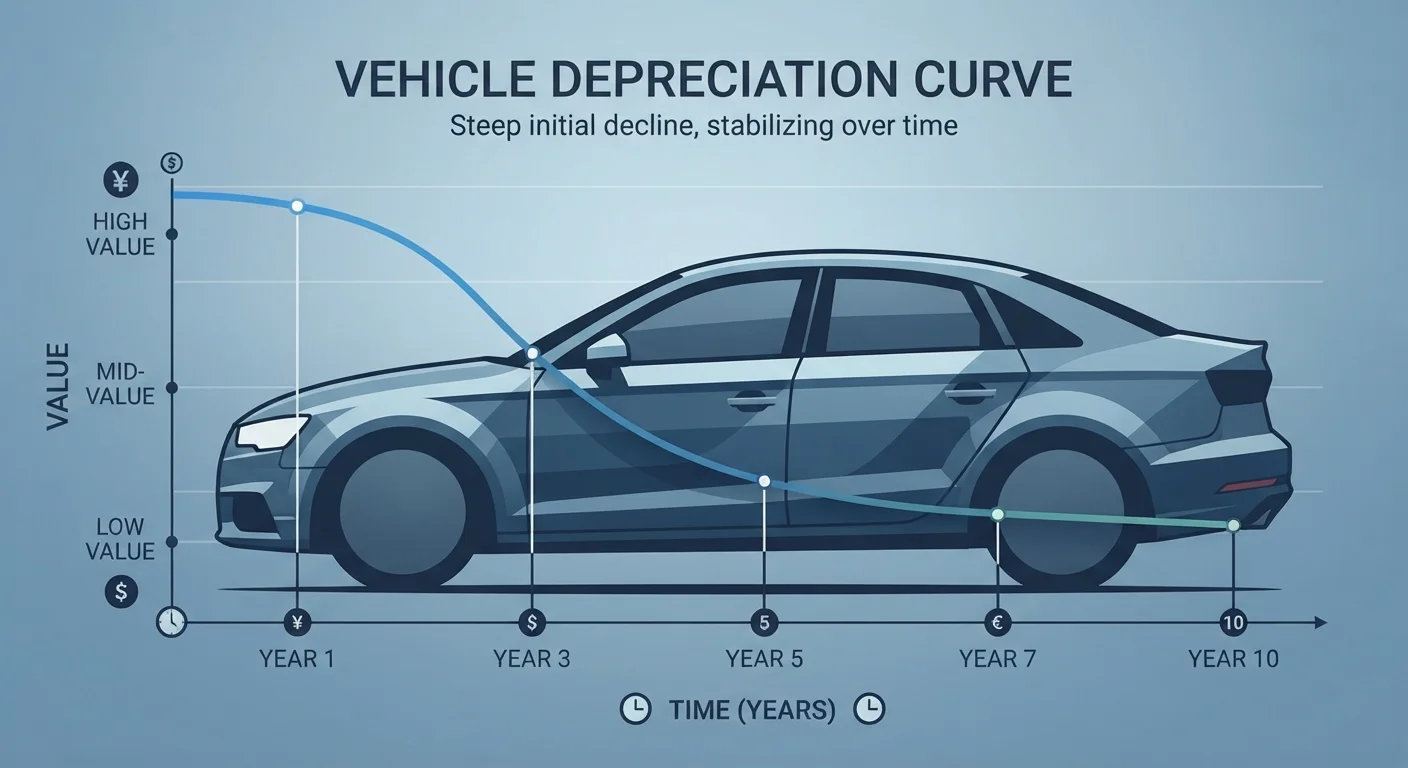
The Shape of Depreciation: A Year-by-Year Breakdown
Depreciation is not a straight line. It follows a steep early drop, a gradual middle phase, and a flattening tail — and understanding that shape can change how you think about buying, owning, and selling. For a deeper grounding in the basics, see Car Depreciation Explained.
| Typical Year-1 Depreciation | 15–25% of purchase price (Industry consensus estimate across mainstream segments) |
| Value Retained After 3 Years | Roughly 50–60% (General benchmark for mid-market vehicles) |
| Steepest Depreciation Phase | Years 1–3 |
| Depreciation Rate by Year 6–8 | Approximately 3–6% annually (Typical range; condition and mileage are key variables) |
| Category With Strongest Resale | Trucks and body-on-frame SUVs (Consistent pattern in U.S. used-vehicle market data) |
| Category With Fastest Depreciation | Luxury vehicles (years 1–3) (Due to technology turnover and new-model competition) |
Here is how a typical mainstream vehicle (think a mid-size sedan or popular crossover) tracks across a decade:
- Year 1: A new vehicle commonly loses 15–25% of its purchase price within the first 12 months. Much of this happens the moment you drive off the lot — a reflection of the premium attached to being the first owner and the gap between retail and wholesale pricing.
- Years 2–3: Depreciation continues at a brisk pace, often another 10–15% per year. By the end of year three, many vehicles retain only 50–60% of their original value.
- Years 4–5: The rate slows noticeably. Annual losses typically drop to 6–10%. The car is now firmly in the used-vehicle market with a stable, transparent pricing history.
- Years 6–8: Depreciation flattens further. Some vehicles hold steady for extended periods; others dip in response to high mileage or emerging mechanical concerns. Annual losses may be 3–6%.
- Years 9–10: Value often stabilizes at a low floor — or, for certain vehicles, begins a slow climb toward collector or cult-classic status. At this stage, condition and mileage matter far more than age.
How Vehicle Category Affects the Curve
Not every segment follows the same trajectory. Category matters enormously — and so does how a vehicle is perceived in the used market.
Depreciation
The reduction in a vehicle's market value over time. It is driven by age, mileage, condition, and supply-and-demand dynamics in the used-car market.
Residual Value
The estimated worth of a vehicle at a specific point in the future, often expressed as a percentage of its original price. Lenders and lessors use this figure to set lease payments.
Depreciation Curve
A graphical representation of how a vehicle's value changes over time. The curve is typically steepest in the first three years and gradually flattens through the end of its serviceable life.
Gap Insurance
An optional auto insurance add-on that covers the difference between what you owe on a vehicle loan and the vehicle's actual cash value if it is totaled or stolen. It is most relevant in the early years of ownership when depreciation can exceed loan paydown.
Actual Cash Value (ACV)
The market value of a vehicle at a given moment, accounting for depreciation, mileage, and condition. Insurers typically use ACV to settle total-loss claims.
Luxury vehicles tend to depreciate faster in the early years than mainstream models. A premium buyer pays for cutting-edge technology and brand cachet, both of which erode quickly as newer versions arrive. By year three, some luxury models retain only 40–50% of their original MSRP.
Trucks and body-on-frame SUVs historically hold value better than cars across most segments. Strong commercial and tradesperson demand, combined with limited inventory sensitivity, keeps resale prices elevated through years four and five.
Electric vehicles (EVs) present a newer and less settled picture. Rapid technology improvements and federal tax credit rules have introduced downward pressure on used EV pricing in some segments — though this varies by brand and model. Buyers evaluating EVs should monitor current market data rather than relying on historical depreciation norms.
Economy and subcompact cars depreciate steadily but start from a lower base, so the absolute dollar loss is smaller even when the percentage is similar to midsize vehicles.
For context on how this plays out between new and used choices, see New Car vs. Used Car Depreciation.
What This Means for Buyers and Owners
Understanding where a vehicle sits on its depreciation curve is one of the most practical tools in a car buyer's toolkit.
~20%
Average first-year value loss for a new vehicle
A widely cited general estimate across mainstream U.S. vehicle segments; exact figures vary by model and market conditions.
50–60%
Typical value retained after three years of ownership
Represents the end of the steepest depreciation phase for most mid-market vehicles in the U.S.
3–5 years
Sweet spot for used-car value vs. remaining life
Vehicles in this range have absorbed the largest losses while still offering many years of serviceable life for most buyers.
If you are buying used, the steepest losses have already been absorbed by the previous owner. A vehicle purchased in years three to five often delivers the best balance of remaining useful life and already-realized depreciation. Timing your used car purchase relative to the depreciation curve can make a meaningful difference in total cost of ownership.
If you are buying new, build the year-one drop into your financial expectations from day one. Gap insurance — which covers the difference between what you owe and what the car is worth if it is totaled — becomes particularly relevant when your loan balance temporarily exceeds the vehicle's depreciated market value. Your total cost picture also includes insurance and registration fees and maintenance costs, which layer on top of depreciation throughout ownership.
If you plan to sell or trade in within five years, prioritize vehicles with documented strong resale performance in that window. Mileage, condition, color, and service records all influence where on the curve a specific vehicle actually lands — not just the category average.
For a broader look at how depreciation separates the economics of new and used purchases, see Depreciation: The Hidden Cost That Separates New from Used.
This article provides general educational information about vehicle depreciation patterns. It is not financial or investment advice. Actual vehicle values depend on many individual factors; consult a qualified professional for guidance specific to your situation.