
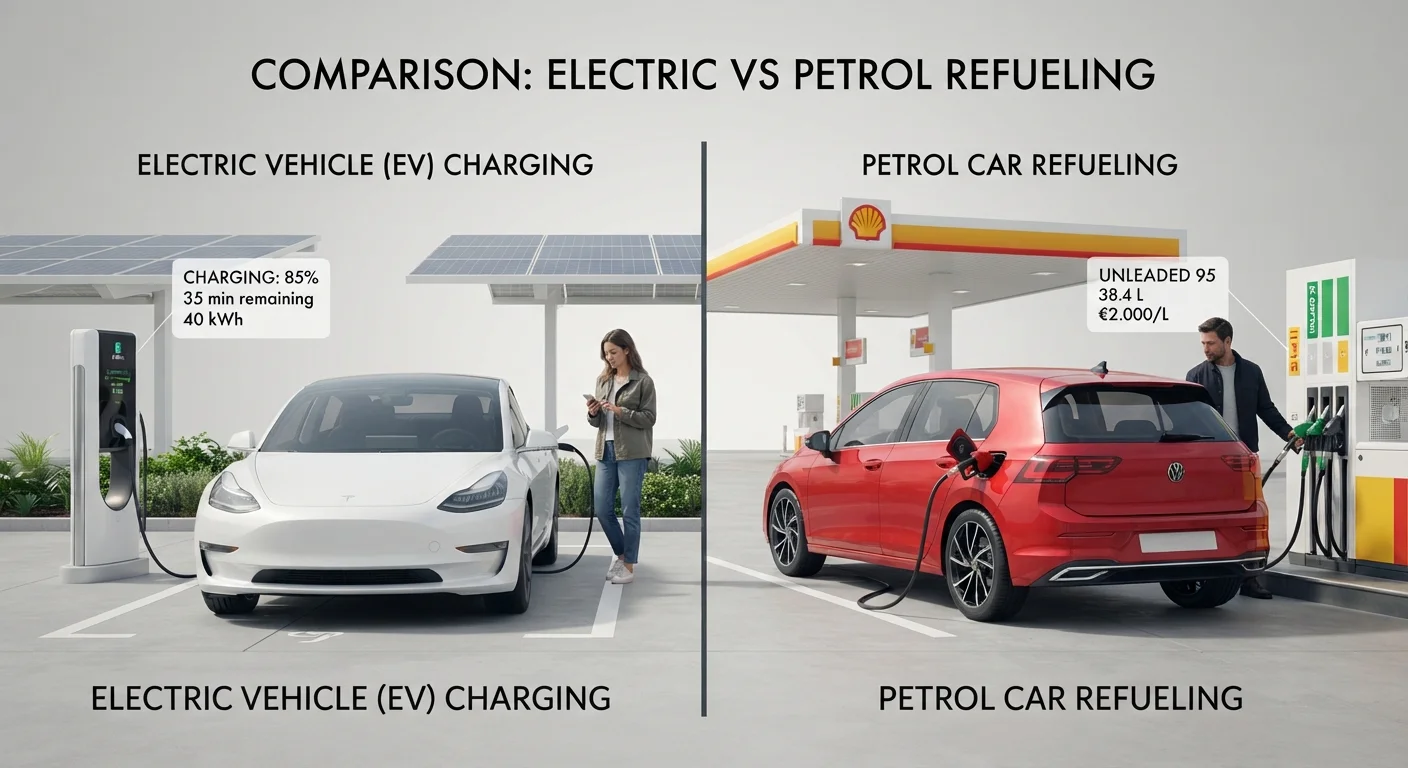
Fuel and Energy Costs: The Biggest Day-to-Day Difference
Electricity is consistently cheaper per mile than petrol or diesel in the United States. Based on EPA efficiency ratings and average national energy prices, most EV drivers pay roughly 3–5 cents per mile when charging at home, compared to approximately 10–15 cents per mile for a typical petrol car at current pump prices. Diesel vehicles fall in a similar range to petrol, with efficiency advantages partially offset by higher per-gallon costs.
Public DC fast charging narrows this gap. Charging at a commercial network typically costs two to three times more than home charging per kWh, which can bring EV energy costs closer to petrol parity on road trips. Drivers who rely primarily on public charging — those in apartments without dedicated outlets, for example — should model this into their calculations rather than assuming home-rate savings.
For a deeper look at how powertrain choice shapes total cost over time, see our full powertrain cost breakdown.
~60%
Lower per-mile energy cost for home-charged EVs
U.S. Department of Energy data consistently shows electricity costs per mile running roughly 60% less than petrol at national average prices and home charging rates.
~40%
Lower scheduled maintenance costs for EVs
DOE analysis has indicated EV scheduled maintenance costs are approximately 40% lower per mile than comparable internal combustion engine vehicles.
Servicing and Maintenance: Fewer Parts, Fewer Bills
EVs eliminate many of the most frequent service items associated with internal combustion engines: oil changes, spark plugs, timing belts, exhaust systems, and transmission fluid services are all absent. The U.S. Department of Energy has noted that EV maintenance costs are generally lower on a per-mile basis than comparable petrol vehicles, though exact figures vary by model and usage.
What EVs do still require: tyre rotations (often more frequently due to higher torque and vehicle weight), brake fluid checks, cabin air filter replacements, and battery coolant service on some models. Regenerative braking tends to reduce brake pad wear significantly. Over a five-year ownership period, these differences can represent meaningful savings.
Our companion article on EV servicing costs vs petrol and diesel covers each service category in detail.
| Cost Category | Electric Vehicle (BEV) | Petrol | Diesel | |
|---|---|---|---|---|
| Energy cost per mile (est.) | ~3–5¢ (home charging) | ~10–15¢ | ~9–14¢ | |
| Oil changes | None required | Every 5,000–7,500 miles | Every 5,000–10,000 miles | |
| Brake wear | Reduced (regen braking) | Standard wear rate | Standard wear rate | |
| Annual servicing complexity | Lower overall | Moderate | Moderate to higher | |
| Insurance premiums | Often higher | Moderate baseline | Moderate baseline | |
| Home setup cost | Possible EVSE install fee | None | None | |
| Federal tax incentives | May qualify (income/model limits) | Generally none | Generally none |
Insurance, Tax, and Registration
EV insurance premiums in the U.S. have generally trended higher than equivalent petrol vehicles, reflecting higher vehicle purchase prices, more expensive replacement parts, and limited repair networks for high-voltage systems. Actual premiums vary widely by driver profile, location, and coverage level — this is general context, not a guarantee of what you will pay. Consult a licensed insurance agent for a quote specific to your situation.
On the tax side, the federal government has offered EV purchase tax credits under IRS guidelines, though eligibility depends on income limits, vehicle assembly location, and battery sourcing rules. State-level incentives, registration fees, and road use charges vary considerably. Some states that previously waived EV registration fees have introduced annual charges to offset reduced fuel-tax revenue. Check the current insurance and fees landscape for ongoing updates.
Model Your Specific Driving Pattern
National averages rarely reflect any one driver's situation. Before concluding which powertrain is cheaper for you, estimate your annual mileage, your realistic home versus public charging split, and your local electricity and petrol rates. A driver covering 15,000 miles per year with reliable home charging will see a very different financial picture than one covering 6,000 miles relying on DC fast chargers. Free online EV cost calculators from the DOE and some state energy agencies can help you run the numbers.
Depreciation and Long-Term Value
Depreciation is often the largest single ownership cost and is frequently overlooked. Early EV models depreciated steeply as battery technology advanced rapidly and range anxiety remained high. More recently, depreciation patterns have stabilized for many EV segments, though they still vary more year-to-year than petrol equivalents due to shifting federal incentive structures and technology cycles.
Petrol and diesel vehicles follow more predictable depreciation curves, though high-demand segments — trucks, SUVs — tend to hold value better than sedans regardless of powertrain. For a nuanced view of how EV values behave over time, our article on electric vehicle depreciation vs petrol and diesel walks through the key variables. For a complete multi-year financial model, see the real cost of EV ownership over five years.
This article provides general financial information for educational purposes only and does not constitute personalized financial or insurance advice. Costs vary by vehicle, location, driver profile, and market conditions. Consult a qualified financial or insurance professional for guidance specific to your circumstances.